Hydrogen mobility
Study objectives
This case study aims at optimizing the sizing and the operation of a hydrogen production for the supply of hydrogen to a vehicles fleet using both electricity produced from photovoltaic (PV) and electricity from the grid. The objective is here to minimize the hydrogen supply cost to the vehicles.
System architecture
The figure opposite illustrates the architecture of the system modeled with the software Odyssey. This system consists in the following components:
- The hydrogen load (supply station)
- The photovoltaic power plant
- The connection to the main electrical grid
- The electrolyzer
- The hydrogen compressor
- The auxiliary allowing to account for the electricity consumed by the electrolyzer
- The hydrogen tank
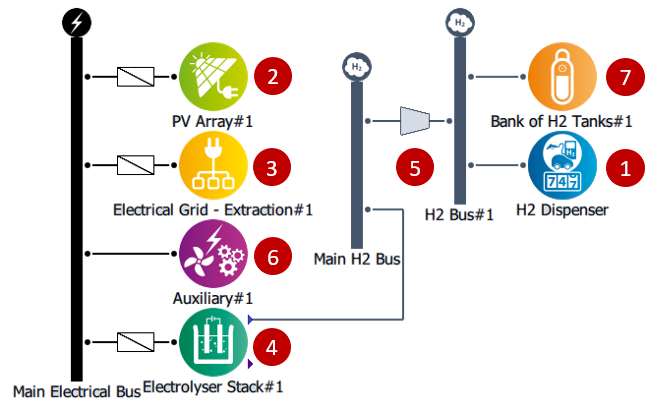
The operation principle consists in powering the electrolyzer, the compressor and the auxiliaries from a mix of electricity produced from the photovoltaic power plant and from the electrical grid.
The energy management strategy consists in permanently adjusting the operating point of the electrolyzer (maximum power, partial power, stand-by) in order to benefit from cheap electricity from the grid while guarantying a sufficient production of hydrogen for the vehicles.
Results examples (time series and sensitivity analysis)
The objective in this study is to minimize the hydrogen supply cost to the vehicle. This indicator is computed from all expenses required for the construction and operation of the hydrogen distribution station (investment and replacement of the different components, operation and maintenance costs and purchase of electricity on the grid).
In order to minimize this cost, it is essential to optimize both the sizing of the different components (PV power plant, electrolyzer, hydrogen storage, etc.) and the energy management strategy to guaranty a purchase of electricity at the lowest possible cost.
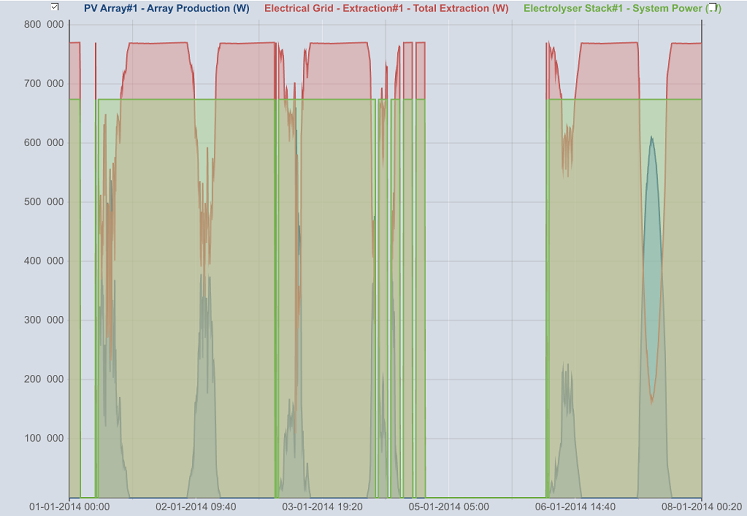
The figure below is an example of dynamic simulation result of the installation operation on a 24h period. We can observe that the electrical network (red) is solicited in order to complete the photovoltaic production (blue) and thus guarantying a constant power supply to the electrolyzer (green) on this period.
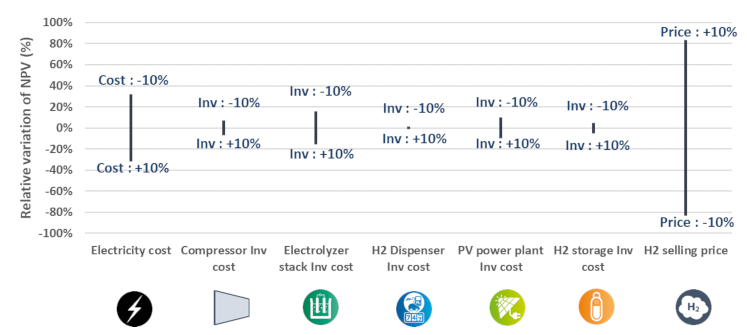
The figure below is an example of sensitivity analysis performed with the software Odyssey and showing the impact of the PV power plant sizing on the hydrogen supply cost. We can observe how an optimal PV power plant sizing can reduce the hydrogen supply cost in comparison to a solution with photovoltaic or in comparison to a solution with an improper photovoltaic power plant sizing.
Results examples (costs structure and cash flow)
As part of this study, economic calculations are carried out over a 20-year operating period with a discount rate of 8%. The figures opposite illustrate examples of economic results from ODYSSEY.
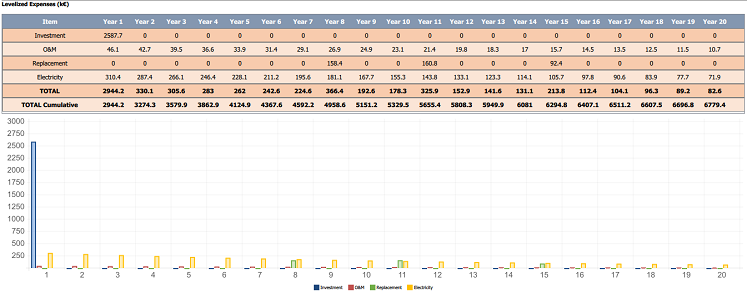
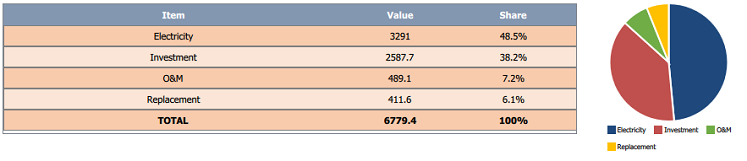
The figure below is an example of the result of the overall cost structure of the project (costs of electricity, investment, operation & maintenance and replacement of components -taking into account ageing-).
The figure below is an example of a cash flow view of expenses over the operating period.